Introduction
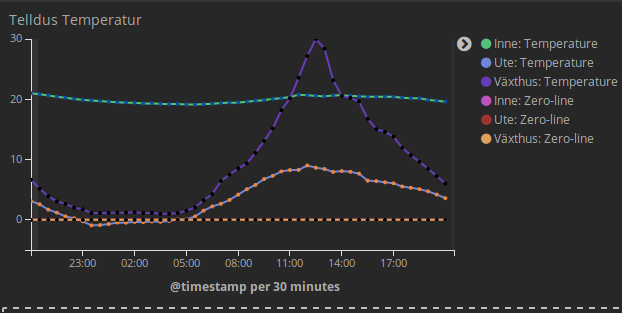
After noticing that logstash now has a http_poller plugin and the fact that Telldus Live provides a JSON API i thought getting the data into elasticsearch for graphing in Kibana would be a piece of cake. It turns it wasn’t really piece of cake but I took the time to piece together the challenges and try to package them so it will hopefully be a breeze for you assuming you already have an ELK stack set up. There are plenty of guides for setting that up so I wont go into that in this post.
Here we go…
Authentication
The first reason you can’t just point the http_poller toward the telldus API is that it is protected by oauth 1 authentication. I have some familiarity with python programming so I decided to build a simply python web server that would authenticate toward the telldus API server and expose it without authentication locally on my network. Mapping terminology here was the biggest challenge I ran into here. Basically this is how you map telldus API terminology to OAuth terminology:
Public key = Consumer key
Private key = Consumer secret
Token = Token secret
Token Secret = Token secret
I then proceeded to create a docker container and docker-compose in order to easily configure and run this simple oauth web server.
Incompatible Data Structure
If you don’t care about how this solution works you can safely skip this section. Basically, once you get the data from a sensor from the Telldus API – the JSON is not formed in a way that elasticsearch can handle well, essentially all the sensor values are inside of a list of objects. Since this data structure is not easily mapped into elasticsearch’s dot-separated key structure you are stuck with sensor value data data is not possible to graph.
The JSON looks like this:
 ...
    "data" :
        [
            {
                "name": "temperature",
                "value": 12
            },
            {
                "name": "humidity",
                "value": 40
            }
        ]
    ...
So to solve this I added a transformation of json object lists to key-value objects instead based on an attribute that can serve as a key. In the above, the “name” attribute is a perfect fit. After transformation the easily digestible JSON will instead look like this:
    "data" :
        {
            "temperature":
                {
                    "value": 12
                },
            "humidity":
                {
                    "value": 40
                }
        }
Putting the pieces together
Set up the oauth proxy using docker-compose. First, make sure you have docker-compose installed. Again, plenty of guides available for this so I wont cover it in this post.
Essentially you need to clone the repo, configure the keys and transformation setting in the docker-compose file and the run the docker container…
git clone https://github.com/kribor/oauth-proxy.git
cd oauth-proxy
Then use your favorite text editor to modify the docker-compose file:
version: '2'
services:
   oauth_proxy:
     build: .
     image: kribor/oauth-proxy
     ports:
       - "5000:5000"
     volumes:
       - .:/code
     environment:
       - OAUTH_PROXY_BASE_URL=https://api.telldus.com/
       - OAUTH_PROXY_CONSUMER_KEY=<consumer-key>
       - OAUTH_PROXY_CONSUMER_SECRET=<consumer-secret>
       - OAUTH_PROXY_TOKEN=<token>
       - OAUTH_PROXY_TOKEN_SECRET=<token-secret>
       - OAUTH_PROXY_JSON_LIST_TO_MAP=data:name
Then your ready to run it using:
docker-compose run
Viola! You now have a nice JSON endpoint for logstash http_poller plugin to check.
You can test it out by finding the URL to one of your sensors (log in to Telldus Live and go to the API explorer to find URLs and IDs of your sensors). Once you find one you can verify that everything is working by performing a curl toward the local proxy. You should see the sensor output JSON, something like this:
curl http://localhost:5000/json/sensor/info?id=11204641

{"clientName": "tec", "id": "11204641", "timezoneoffset": 7200, "editable": 1, "lastUpdated": 1493491193, "protocol": "fineoffset", "sensorId": "151", "name": "vaxthus", "ignored": 0, "keepHistory": "0", "data": {"humidity": {"value": "60", "scale": "0"}, "temp": {"value": "5.8", "scale": "0"}}, "battery": "254"}
The last piece now is to configure logstash to poll this data and push it into elasticsearch. While this is not the focus of this post, here’s an example logstash config to achieve this:
input {
  http_poller {
    # List of urls to hit
    # URLs can either have a simple format for a get request
    # Or use more complex HTTP features
    urls => {
      in => "http://localhost:5000/json/sensor/info?id=738560"
      out => "http://localhost:5000/json/sensor/info?id=738560"
      greenhouse => "http://localhost:5000/json/sensor/info?id=1120464"
    }
    # Maximum amount of time to wait for a request to complete
    request_timeout => 30
    # How far apart requests should be - 5 min
    schedule => { cron => "*/5 * * * * UTC"}
    # Decode the results as JSON
    codec => "json"
    # Store metadata about the request in this key
    metadata_target => "http_poller_metadata"
  }
}
filter {
  # Fix the lastupdated field so that it becomes a valid date.
  date {
    match => [ "lastUpdated","UNIX" ]
    target => " lastUpdatedDate"
  }
  mutate {
    remove_field => [ "lastUpdated" ]
    # Ensure elasticsearch treats sensor values as numbers
    convert => {
      "battery" => "integer"
      "[data][temp][scale]" => "float"
      "[data][temp][value]" => "float"
      "id" => "integer"
      "[data][humidity][scale]" => "float"
      "[data][humidity][value]" => "float"
      "keephistory" => "boolean"
    }
  }
}
output {
  elasticsearch {
    hosts => ["localhost:9200"]
    index => "logstash-telldus-%{+YYYY.MM.dd}"
  }
}