So, last week our kibana dashboard kept crashing due to random 502 errors. The errors did not happen when using kubectl port-forward so I assumed something was wrong with the load balancer config but couldn’t find anything to tweak. After respose from support it’s most likely an error due to kibana server keepalive default was lower than GCP lb as described here: https://blog.percy.io/tuning-nginx-behind-google-cloud-platform-http-s-load-balancer-305982ddb340
The setup is:
GCP Load balancer -> Load Balancer Ingress (https via gke-managed-certs) -> Kube service -> Kube deployment
After giving up trying to change the keepalive settings for kibana which is not supported. I decided to throw an nginx proxy in front of kibana with a sidecar-container proxying requests. To insert the sidecar I added another container:
- name: kibana-sidecar-container-nginx
  # Simple sidecar: nginx-keepalive
  image: naturalcycles/gcp-iap-proxy:test-keepalive
  ports:
    - containerPort: 80
  env:
    - name: UPSTREAM_URL
      value: "http://127.0.0.1:5601" # This points at main kibana container
This seems to have resolved all of the 502s 🎉 For many cases you can probably modify the existing deployment with better keepalive settings but this is simple to prove, generic quick-fix that’s reasonably stable.
To get the service to point to nginx instead I tested first with kubectl port-forward to the pod and when it worked, I just changed the service to go to pod port 80 instead of 5601.
Going deeper into the nginx container, it’s a very minimal nginx reverse proxy…
nginx.conf:
events {
}

http {
    # Settings to play nice with GCP load balancer
    keepalive_timeout  650;
    keepalive_requests 10000;

    server {
      listen 80;
      listen [::]:80;

      location / {
          proxy_pass $UPSTREAM_URL; # make it generic
      }
    }
}
And finally the docker file to include config and support env vars:
Ok, why this guide? There are lots of ways of automating HTTPS on Kubernetes and some apply on GKE. I was already a bit put off by cert-manager not being official/supported and when it appeared it wouldn’t work at all with godaddy as DNS provider I went digging and found this:
It seemed promising and very much what I was looking for. The caveats of paying for google to manage certificates and paying for a load balancer per namespace (as is the case for ingress-linked load balancers) are both fine. It turns out that this solution has no complete documentation or examples – but it does seem to work well.
TL;DR: Readme for 3 examples available here: https://github.com/kribor/gke-managed-certs-example
How does it work?
Basically you need:
A GKE cluster (tested on 1.11.6) with admin access and IAM admin access
One or more domains for which you can set DNS records
Basic kubernetes knowledge
Solution is based on:
Custom Controller – Monitors your cluster for certificates and ingresses matching those to automatically provision certificates using compute API
NodePort Services and google load balancer backed ingresses with static IPs
Example 1
The first example goes through the process of installing the controller including the mainly undocumented requirements of replacing the node pool running your nodes with one that has compute engine API admin rights (you probably don’t want to use this node pool for all your workload for security reasons) – and – creating some clusterrolebindings.
It is pretty in-depth, explaining the process and some of the things that can go wrong.
Example 2 takes it beyond the basics and describes how to share a load balancer/ingress in a namespace with different services and domain names
Example 3
Example 3 goes on to a second namespace – controller and CRDs are global and don’t need any changes but a separate IP/ingress/load balancer is required.
Troubleshooting
For some reason logs from the controller are not logged to system out, meaning they wont show up in stackdriver. It does have some useful logs if things go wrong though, you just need to jump through some hoops to get them – described at the bottom of the readme:
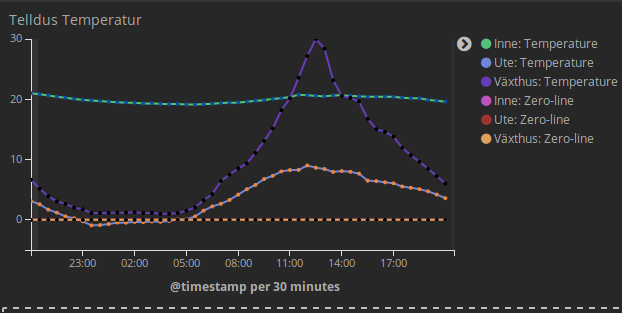
After noticing that logstash now has a http_poller plugin and the fact that Telldus Live provides a JSON API i thought getting the data into elasticsearch for graphing in Kibana would be a piece of cake. It turns it wasn’t really piece of cake but I took the time to piece together the challenges and try to package them so it will hopefully be a breeze for you assuming you already have an ELK stack set up. There are plenty of guides for setting that up so I wont go into that in this post.
Temperatures from Telldus API visualized in Kibana
Here we go…
Authentication
The first reason you can’t just point the http_poller toward the telldus API is that it is protected by oauth 1 authentication. I have some familiarity with python programming so I decided to build a simply python web server that would authenticate toward the telldus API server and expose it without authentication locally on my network. Mapping terminology here was the biggest challenge I ran into here. Basically this is how you map telldus API terminology to OAuth terminology:
I then proceeded to create a docker container and docker-compose in order to easily configure and run this simple oauth web server.
Incompatible Data Structure
If you don’t care about how this solution works you can safely skip this section. Basically, once you get the data from a sensor from the Telldus API – the JSON is not formed in a way that elasticsearch can handle well, essentially all the sensor values are inside of a list of objects. Since this data structure is not easily mapped into elasticsearch’s dot-separated key structure you are stuck with sensor value data data is not possible to graph.
So to solve this I added a transformation of json object lists to key-value objects instead based on an attribute that can serve as a key. In the above, the “name” attribute is a perfect fit. After transformation the easily digestible JSON will instead look like this:
Set up the oauth proxy using docker-compose. First, make sure you have docker-compose installed. Again, plenty of guides available for this so I wont cover it in this post.
Essentially you need to clone the repo, configure the keys and transformation setting in the docker-compose file and the run the docker container…
git clone https://github.com/kribor/oauth-proxy.git cd oauth-proxy
Then use your favorite text editor to modify the docker-compose file:
Viola! You now have a nice JSON endpoint for logstash http_poller plugin to check.
You can test it out by finding the URL to one of your sensors (log in to Telldus Live and go to the API explorer to find URLs and IDs of your sensors). Once you find one you can verify that everything is working by performing a curl toward the local proxy. You should see the sensor output JSON, something like this:
The last piece now is to configure logstash to poll this data and push it into elasticsearch. While this is not the focus of this post, here’s an example logstash config to achieve this:
input {
  http_poller {
    # List of urls to hit
    # URLs can either have a simple format for a get request
    # Or use more complex HTTP features
    urls => {
      in => "http://localhost:5000/json/sensor/info?id=738560"
      out => "http://localhost:5000/json/sensor/info?id=738560"
      greenhouse => "http://localhost:5000/json/sensor/info?id=1120464"
    }
    # Maximum amount of time to wait for a request to complete
    request_timeout => 30
    # How far apart requests should be - 5 min
    schedule => { cron => "*/5 * * * * UTC"}
    # Decode the results as JSON
    codec => "json"
    # Store metadata about the request in this key
    metadata_target => "http_poller_metadata"
  }
}
filter {
  # Fix the lastupdated field so that it becomes a valid date.
  date {
    match => [ "lastUpdated","UNIX" ]
    target => " lastUpdatedDate"
  }
  mutate {
    remove_field => [ "lastUpdated" ]
    # Ensure elasticsearch treats sensor values as numbers
    convert => {
      "battery" => "integer"
      "[data][temp][scale]" => "float"
      "[data][temp][value]" => "float"
      "id" => "integer"
      "[data][humidity][scale]" => "float"
      "[data][humidity][value]" => "float"
      "keephistory" => "boolean"
    }
  }
}
output {
  elasticsearch {
    hosts => ["localhost:9200"]
    index => "logstash-telldus-%{+YYYY.MM.dd}"
  }
}
Kibana graphs are extremely useful for keeping track of server health! So why not use it to keep track of your Zimbra server?
This article describes how to set up grok filters for parsing email relay (inbound, outbound, internal etc.) and spam rejection in the new and awesome postscreen which has really cleaned up spam in zimbra with the 8.7 release.
This was actually what triggered me to do the work on this, I wanted to know how effective the spam processing in postscreen was.
Assumptions:
Zimbra server up and running 8.7 (the email relay filters probably work for older zimbra versions as well)
ELK stack up and running and zimbra syslog forwarded to elastic via logstash (this is where the grok magic happens).
Links:
Must have debugging of grok filters: https://grokdebug.herokuapp.com/Lets start with the postscreen blocks. These are logged with messages similar to:
NOQUEUE: reject: RCPT from [89.36.215.249]:51025: 550 5.7.1 Service unavailable; client [89.36.215.249] blocked using b.barracudacentral.org; from=<test@mail.com>, to=<test@mail.com>, proto=ESMTP, helo=<test.biz>
After some fiddling I ended up with the following grok filter to parse the interesting fields (I will update this as needed if it fails to parse:
I will try to update the above as more examples comes with emails hitting my zimbra.
Just in case you don’t have everything sorted with logstash parsing etc. here’s an example of how I’ve set up logstash to parse syslog and send it on to a rabbit queue. With this setup you can set up rsyslog to forward logs directly to logstash on port 10514.
# This input block will listen on port 10514 for logs to come in.
# host should be an IP on the Logstash server.
# codec => "json" indicates that we expect the lines we're receiving to be in JSON format
# type => "rsyslog" is an optional identifier to help identify messaging streams in the pipeline.
input {
        syslog {
                port => 10514
                type => "logs"
        }
}

# This is an empty filter block.  You can later add other filters here to further process
# your log lines
filter {
  if [message] =~ "NOQUEUE: reject:" {
    grok {
      match => [ "message", "%{NOTSPACE:intro}: %{NOTSPACE:action}: (?<request>[^\[]*)()?\[%{IP:ip}\]:(%{WORD:port}:)? (?<response>(.+?);) (?<info>(.+?);)?( )?from=<(%{NOTSPACE:from})?>([ ,]*)?to=<%{NOTSPACE:to}>([ ,]*)?%{GREEDYDATA:rest}" ]
    }
    if "_grokparsefailure" not in [tags] {
      geoip { # https://www.elastic.co/guide/en/logstash/current/plugins-filters-geoip.html
        source => "ip"
      }
      mutate {
        remove_field => [ "severity_label", "severity", "priority", "logsource", "facility_label", "facility" ]
        replace => { "type" => "zimbra-block" }
      }
    }
  }
  else if "Relayed" in [message] {
    grok {
      match => [ "message", "\(%{NOTSPACE:id}\) (?<result>[^\{]*) \{%{NOTSPACE:action}\}, (?<source_str>[^\[]*)\[%{IP:ip}\]:%{INT:port:int} (\[%{IP:ip2}\] )?\<(%{NOTSPACE:from})?\> -\> \<%{NOTSPACE:to}\>, (quarantine: %{NOTSPACE:quarantine},)?Queue-ID: %{NOTSPACE:queue_id}, Message-ID: \<%{NOTSPACE:message_id}\>, mail_id: %{NOTSPACE:mail_id}, Hits: %{NOTSPACE:hits:float}, size: %{NOTSPACE:size:int}, queued_as: %{NOTSPACE:queued_as}, (dkim_sd=%{NOTSPACE:dkim}, )?%{INT:proccesing_time:int} ms" ]
    }
    if "_grokparsefailure" not in [tags] {
      if [ip] not in ["127.0.0.1", "10.1.1.1"] {
        geoip { # https://www.elastic.co/guide/en/logstash/current/plugins-filters-geoip.html
          source => "ip"
        }
      }
      mutate {
        remove_field => [ "severity_label", "severity", "priority", "logsource", "facility_label", "facility" ]
        replace => { "type" => "zimbra-relayed" }
      }
    }
  }
}

# Output to elastic"
output {
  if [type] == "logs" {
    elasticsearch {
      hosts => [ "127.0.0.1" ]
      index => "logstash-syslog-%{+YYYY.MM.dd}"
    }
  }
  else if [type] == "zimbra-block" {
    elasticsearch {
      hosts => [ "127.0.0.1" ]
      index => "logstash-zimbra-block-%{+YYYY.MM.dd}"
    }
  }
  else if [type] == "zimbra-relayed" {
    elasticsearch {
      hosts => [ "127.0.0.1" ]
      index => "logstash-zimbra-relayed-%{+YYYY.MM.dd}"
    }
  }
}
Below you will find a simple python script that can be used together with crontab or manually to clear out old daily elasticsearch indices. You just need to specify the index name and how many days back (from today) that you want to remove.
Example use to delete syslog indices older than 90 days:
python clean-old-indices.py syslog 90
#!/usr/bin/env python
# -*- coding: utf8 -*-

__author__ = "Kristofer Borgström"
__credits__ = "Mattias Hemmingsson"

import sys, getopt, urllib2, datetime


def usage():
    print "clean-old-indices.py [-h <elastic host>] <index> <days-to-keep>"
    print "Example: python clean-old-indices.py -h 1.1.1.1 logstash-syslog 90"
    print "Default host is: localhost"


def es_execute(hostname, path, method="GET"):
    """
    Run the command against the elasticsearch server
    """

    url = "http://{0}:9200/{1}".format(hostname, path)

    req = urllib2.Request(url)
    req.get_method = lambda: method

    res = urllib2.urlopen(req)

    return res.read()


try:
    # Parse the arguments and options
    argv = sys.argv[1:]
    opts, args = getopt.getopt(argv, "h:")

    if len(args) != 2:
        raise getopt.GetoptError("")

    host = "localhost"
    for o, a in opts:
        print o
        if o == '-h':
            host = a

    arg_iter = iter(args)
    index_name = arg_iter.next()
    days = int(arg_iter.next())

    # Index cutoff definition, remove older than this date
    earliest_to_keep = datetime.date.today() - datetime.timedelta(days=days)

    index_cutoff = "{0}-{1}".format(index_name, earliest_to_keep.strftime("%Y.%m.%d"))

    all_indices =  es_execute(host, '_cat/indices')

    for line in all_indices.splitlines():
        index = line.split(" ")[2]

        if index.startswith(index_name) and index < index_cutoff:
            print "Deleting index: %s"% index
            es_execute(host, index, method="DELETE")

except getopt.GetoptError:
    usage()
    sys.exit(2)
Linux NetworkManager is a great utility that usually “just works”, yesterday I did however notice that I was not able to access an internal network while using an OpenVPN connection through NetworkManager because the domain names were not resolved as they should (my normal DNS was used instead of the DNS that the openvpn server pushes out).
Finding a solution was not easy and there appears to be no way of manually overriding DNS server either. Eventually I found this bug which has been around for a couple of years and is still not solved.
Fortunately the workaround is simple – you need to disable NetworkManager’s use of DnsMasq. This is done by modifying the configuration file. To modify it you need to open it with a text editor (like gedit) as administrator (sudo). Open a terminal and paste this command (right-click and choose paste – ctrl+v doesn’t work in the terminal):
It will ask you for your password and then open the file so that you can put a # before the dns=dnsmasq line (this means this setting is now disabled) and click save and close the text editor.
Disable dnsmasq to get DNS server from openvpn server
Finally you need to restart the network manager (or reboot):
So why would you want to do this when most posts on the Internet indicate that this is security by obscurity and a bad idea. Well, first and most important, at least for me – I wan’t my wordpress admin to be protected by HTTPS encryption but SSL certificates are expensive so I don’t want to buy one for each new site I host.
Secondly, while I don’t believe in relying on security by obscurity, I see no reason to make life easy for a potential attacker.
This setup is tested on WordPress 3 and 4.
Setup
This post is based on the following setup:
One Apache reverse proxy host that only redirects traffic to other virtual servers that run the actual sites. Lets call it the Proxy server and assign it IP 10.0.0.2
One existing site for which I have valid TLS certificate. Lets call this server web1, IP 10.0.0.3
One or more wordpress servers, lets call it wordpress and assign it IP 10.0.0.4
On the wordpress server there is a blog called blog, which is publicly accessible through blog.example.com.
Although I believe this setup makes sense for a lot of reasons, most of this guide will work even if you have everything on one server.
The challenges
If you are familiar with Apache’s mod_proxy, you may think this is as easy as forwarding a sub folder on your existing HTTPS-enabled site to a wordpress instance but unfortunately, WordPress is very sensitive to whether it is installed on a specific domain, in a subfolder etc. and trying this you will notice a lot of broken links. Also, WordPress cookies have a path that must match for the login to work.
If you have domain-name based virtual hosts to have several WordPress sites on the same server, you need to pass on the proper host name of the WordPress site, blog.example.com in this case.
The Solution
We use mod_proxy to forward traffic to the different sites’ admin urls.
We ensure ProxyPreserveHost is Off, set the internal IP of the blog in the hosts file of the proxy server, allowing us to use the domain name in the ProxyPass statement.
We can use mod_substitute (ensure it’s enabled on the proxy host) to fix the broken links that come back from the wordpress server which thinks the client is accessing the site through http://blog.example.com
Finally we leverage ProxyPassReverseCookiePath to fix the cookies.
So, where’s the code? Here we go…
In the virtual host of the HTTPS-enabled site on the proxy server:
If you also want to block the admin from working when going to the direct URL, i.e. http://blog.example.com/wp-login.php you can add the following to the Apache virtual host for the blog itself:
RewriteEngine On
RewriteCond %{REQUEST_URI} wp-login|wp-admin
RewriteRule .   "-" [F]
Let me know in the comments if you’re facing any issues with this.
Are you using Zimbra to store your tasks or maybe just make notes online but want these to be available when you are offline as well? This guide describes how to set this up by using Mozilla Thunderbird on your computer. This guide was composed on Ubuntu Linux but will work on any operating system like Windows or MacOS.
Note: If you are using text formatting (bold, italic, fonts etc.) – it’s important to understand that Thunderbird does not understand this format and as soon as you change a task from Thunderbird – while your text is synchronized – this formatting will be lost. You can still view your tasks and notes offline without losing any formatting.
Zimbra Tasks
The steps involved to accomplish this are:
Install Thunderbird (not part of this guide)
Set up email sync or skip
Install the Lightning (Calendar) add-on
Add one or more new network calendar of type caldav (https://zimbra.libertar.se/dav/test@libertar.se/Tasks)
If you are tech-savvy, these steps are probably enough to get you through the process, otherwise just follow the step by step guide below.
Installing Thunderbird is not part of this guide since this will depend on your operating system. On Ubuntu Linux it’s available through the Ubuntu Software Center, on non-linux platforms you probably have to download and install.
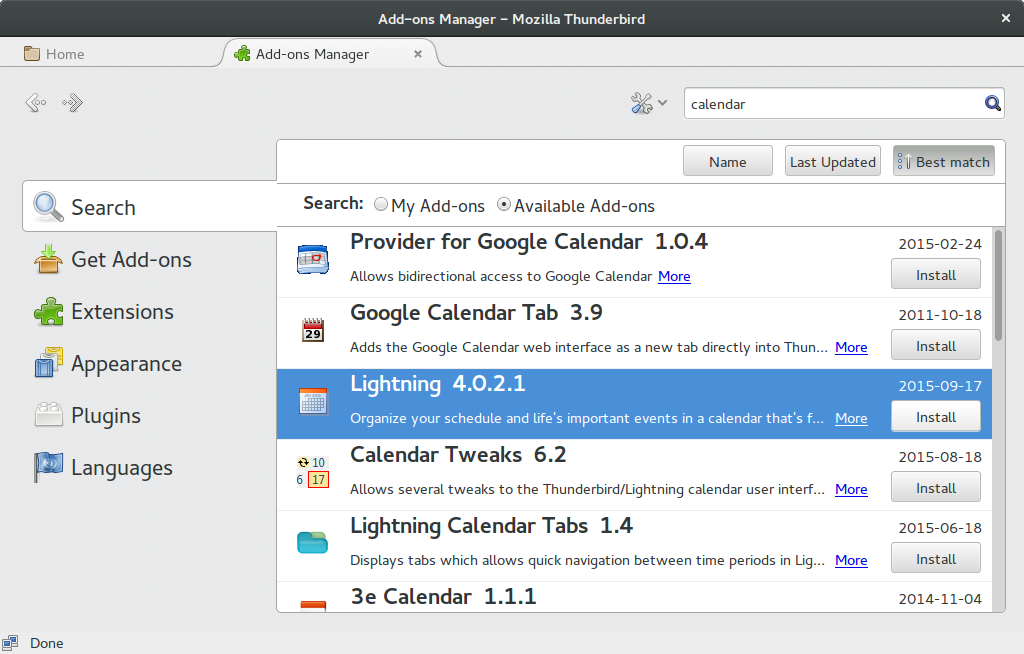
Install Lightning plug-in
Thunderbird does actually not come with support for Tasks so you need to install the add-on Lightning which is basically a calendar with support for tasks and notes. You will find the add-ons in the settings as shown in these screen shots:
After installing lightning you need to restart Thunderbird.
Synchronizing tasks
As you will notice in this guide, many steps refer to calendar instead of task lists or notes. This is because the tasks are technically part of calendar synchronization – and since this works very well – this is the standard way of synchronizing tasks as well.
Follow these steps to set up your first list of tasks:
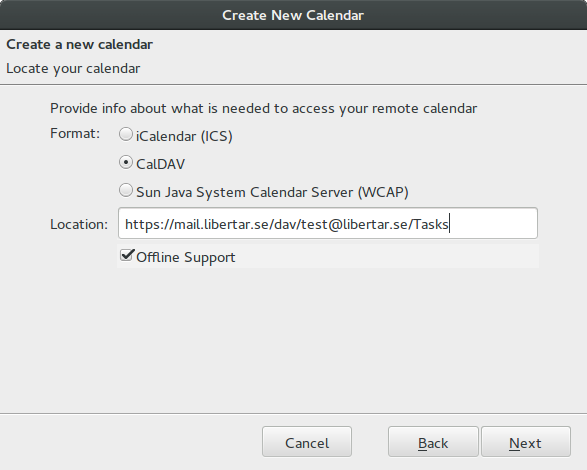
Choose network calendar
Select the caldav option and create the location link in this format: https://<zimbra-webmail-server>/dav/<zimbra-email-address>/<task-list-name>
You need to replace the information in the “<>” with the proper values for your zimbra server. The “task-list-name” is the name you see in zimbra, Tasks and My Notes in this example.
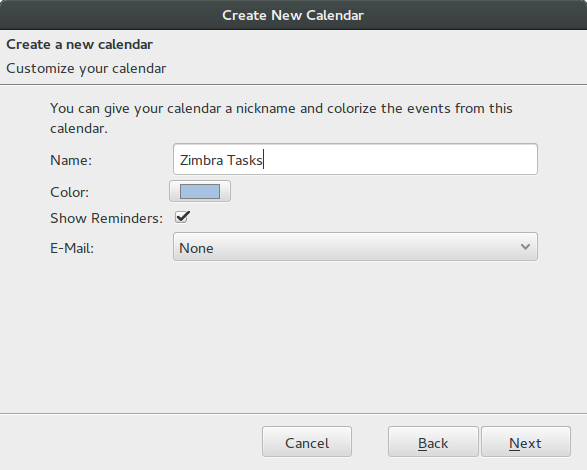
On the next step you can give the task list a name, like Zimbra Tasks or whatever you want.
Then just click next and then Finish. You will be asked for your email address and password during this step. You are now ready to set up another task list or go ahead and check or update your tasks.
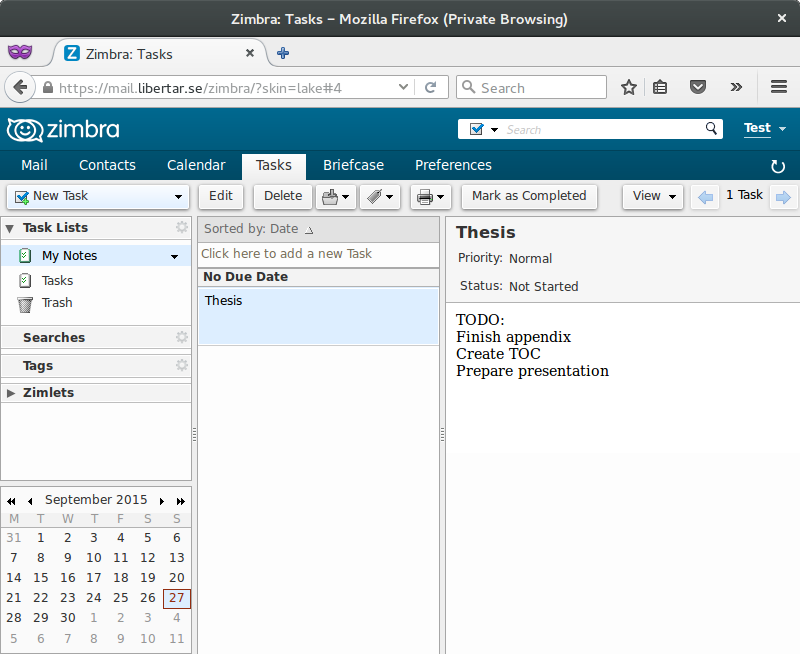
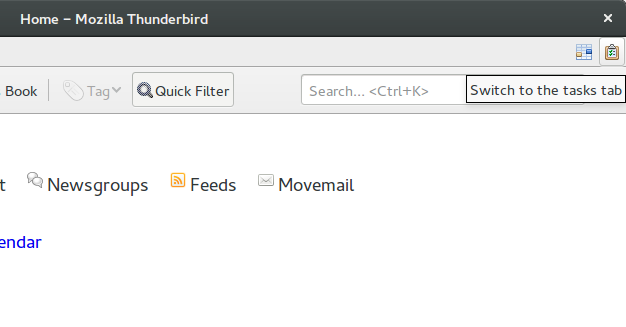
You can check out your tasks/notes by going to the tasks view in the upper-right corner:
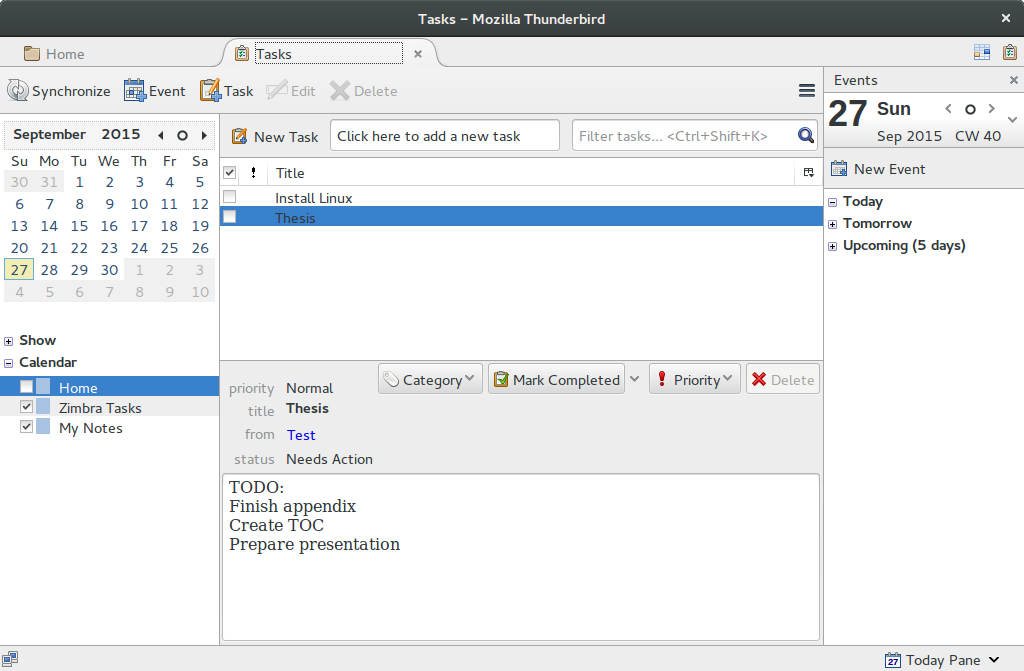
Reviewing and creating tasks
After adding both lists in this example my tasks section looks like this:
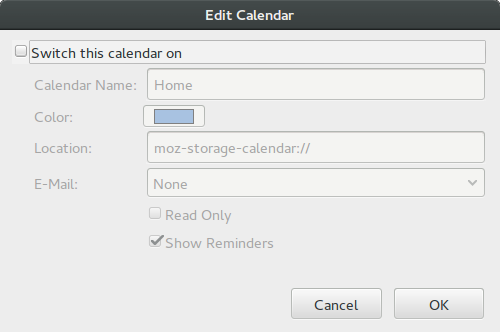
Disabling the Home calendar
At this point you may want to disable Thunderbirds default task list “Home” if you are not using it since this will otherwise be the default “calendar” when new tasks are created – and tasks added to Home will not be synced.
To do this, right click “Home” in the section to the bottom left, choose properties and then untick the “Switch this calendar on”
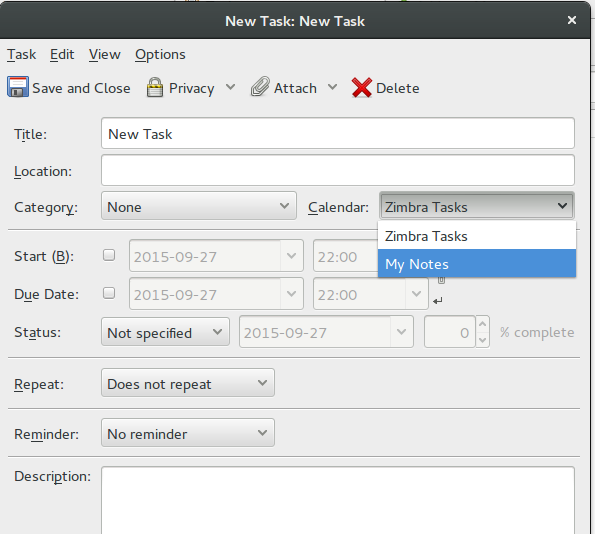
Creating new tasks
Creating new tasks is quite straight-forward. You click new task and then enter the details for the task. There is one very important selection though – make sure you select the proper “calendar” to add it to so that it will be synced back to zimbra properly.